内容提要
- 课程章节:5.1 - 5.2 *
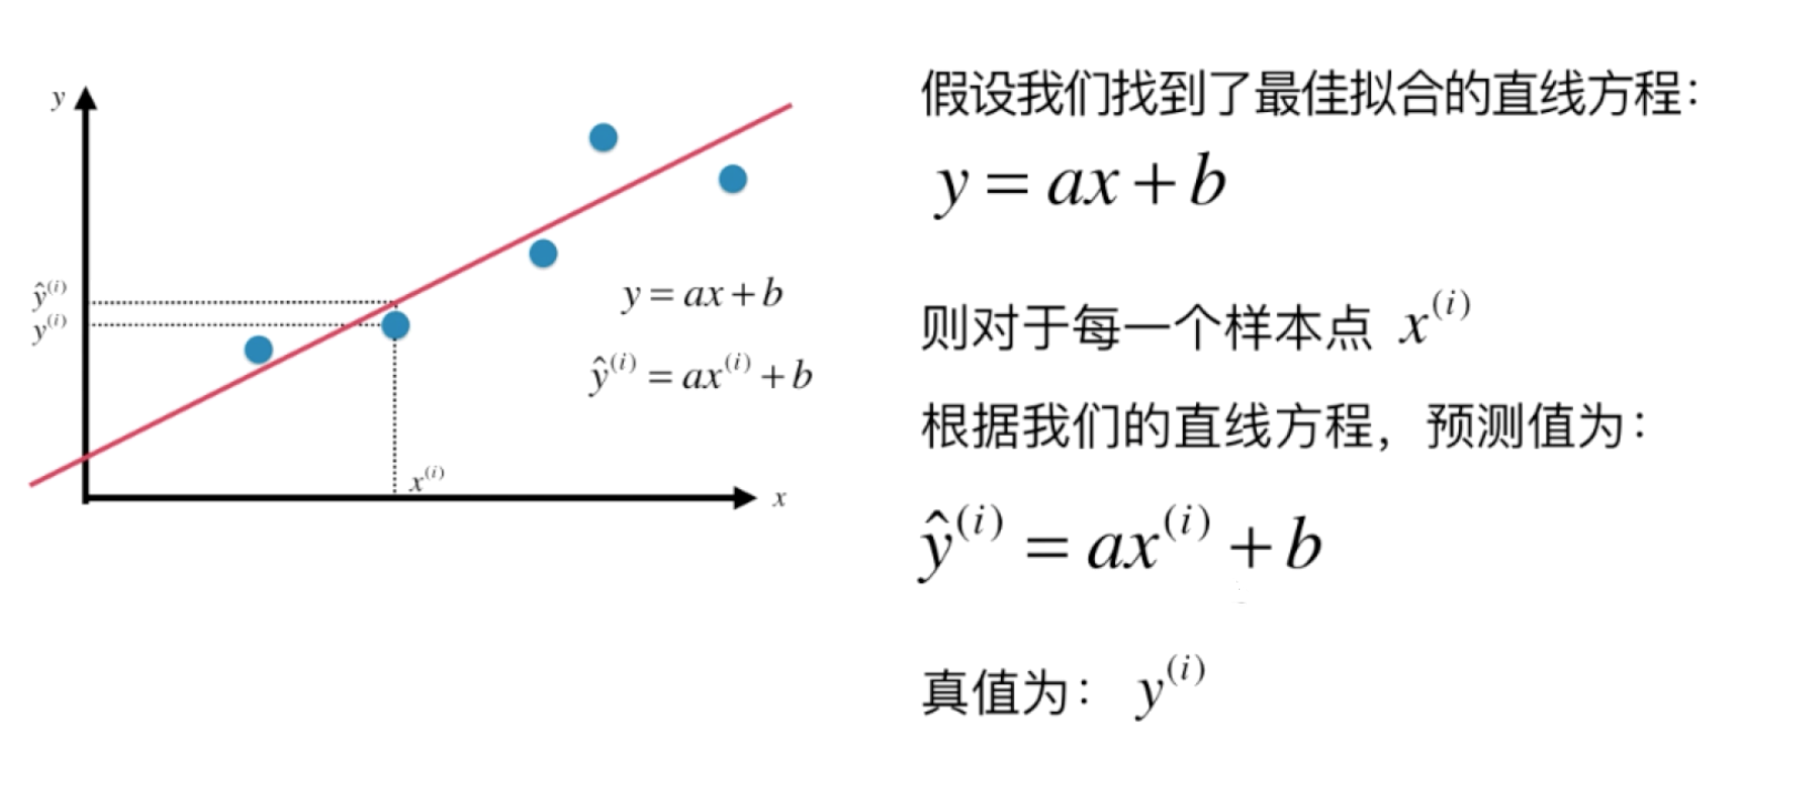
样本特征只有一个
基本图示
目标
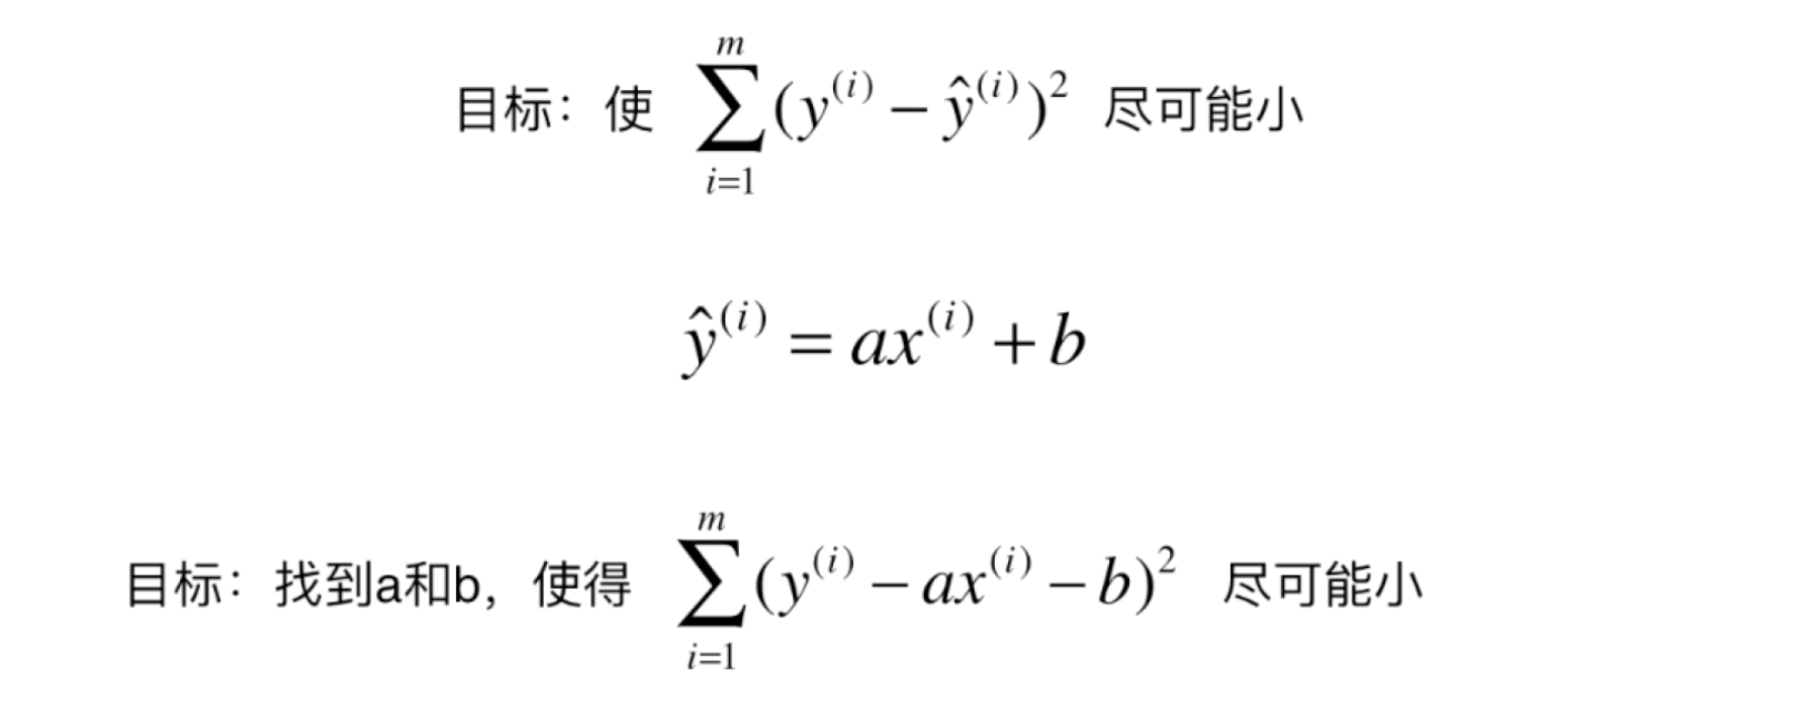
- 损失函数 loss function
- 效用函数 utiliy function
思路
通过分析问题,确定问题的损失函数或效用函数;通过最优化损失函数或者效用函数,获得机器学习的模型
近乎所有参数学习算法都是这样的套路:线性回归,SVM,多项式回归,神经网络,逻辑回归 —–> 最优化原理,凸优化
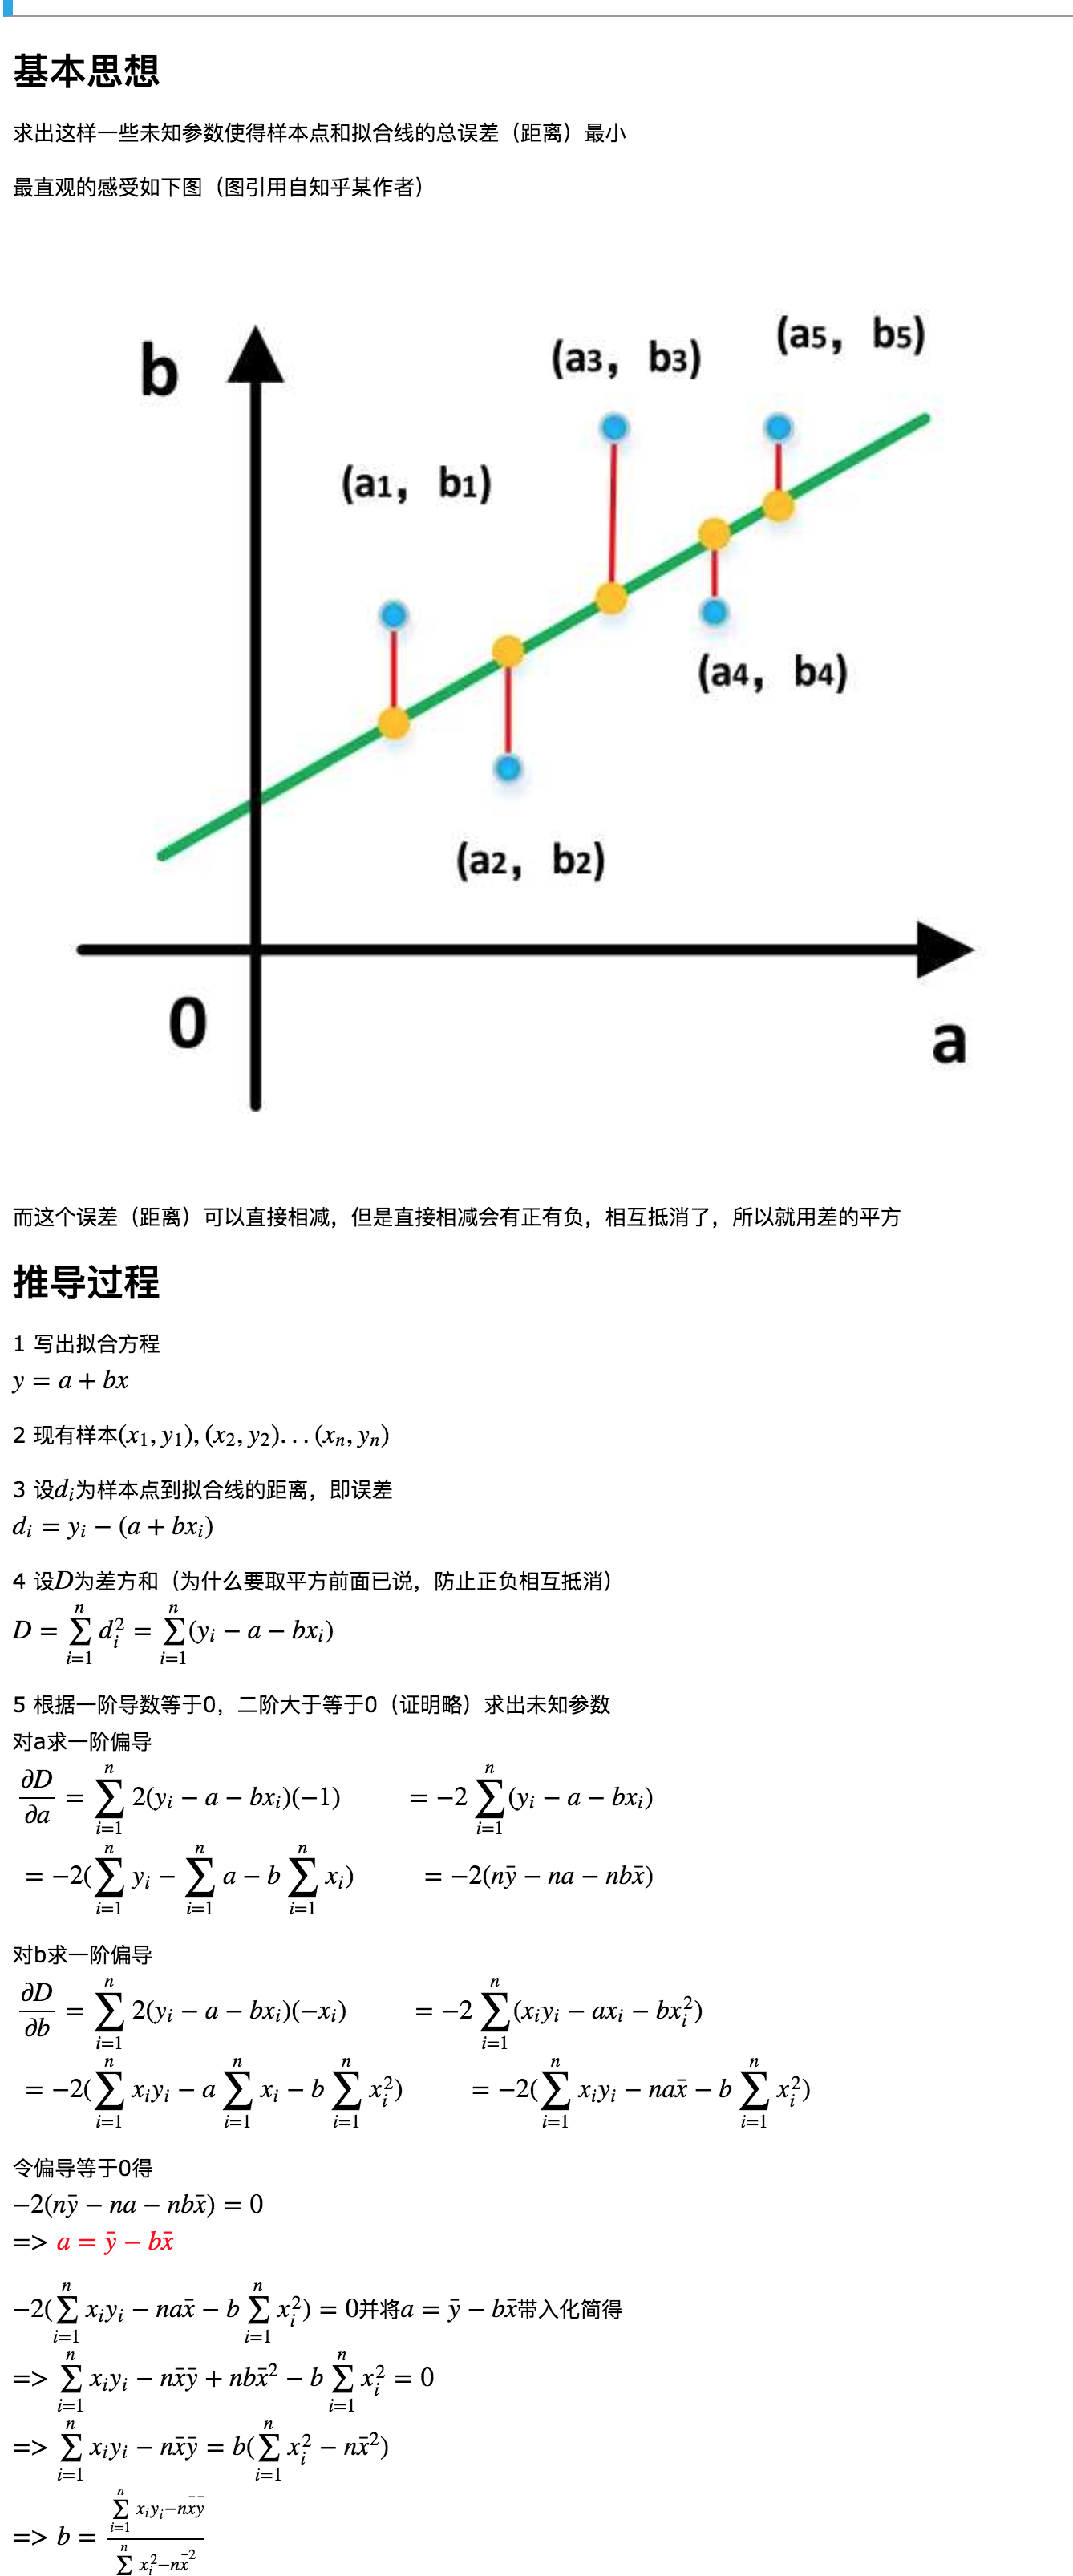
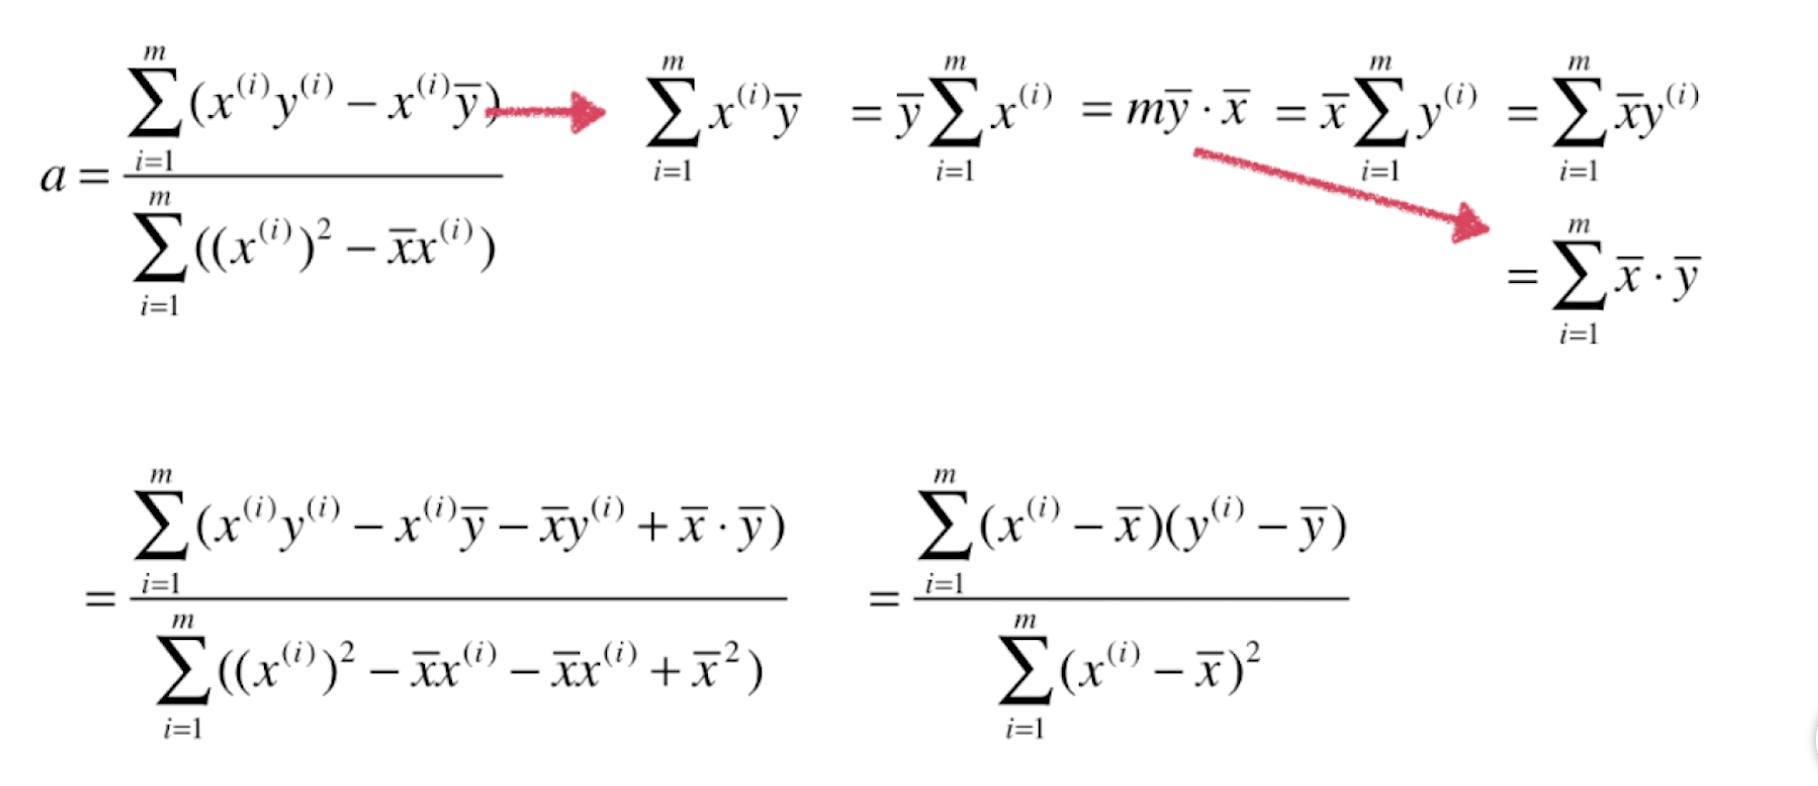
公式
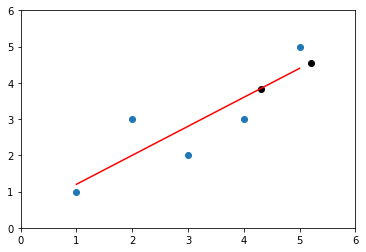
如下图
代码
1 | import numpy as np |
执行
1 | import numpy as np |
样本特征只有一个
通过分析问题,确定问题的损失函数或效用函数;通过最优化损失函数或者效用函数,获得机器学习的模型
近乎所有参数学习算法都是这样的套路:线性回归,SVM,多项式回归,神经网络,逻辑回归 —–> 最优化原理,凸优化
如下图
1 | import numpy as np |
1 | import numpy as np |